Machine Learning Helps to Predict Google Adwords
Predicted Clicks vs Actual Clicks
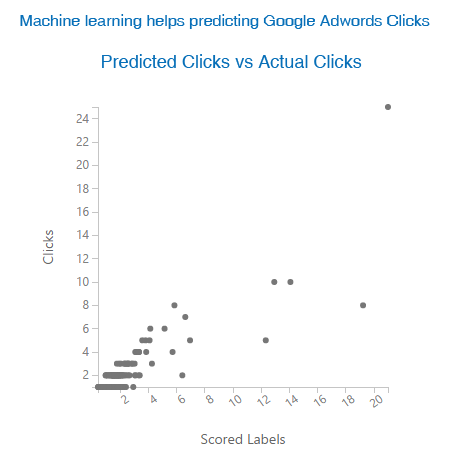
Machine Learning helps predicting Google Adwords Clicks
Results of Machine Learning: Predicted Clicks vs. Actual Clicks, it shows that there is a general 45 degree positive slope. This is a strong indication that there is a near 1:1 relationship between predicted values vs. actual results.
How we Lowered Google Adwords Cost by 37%?
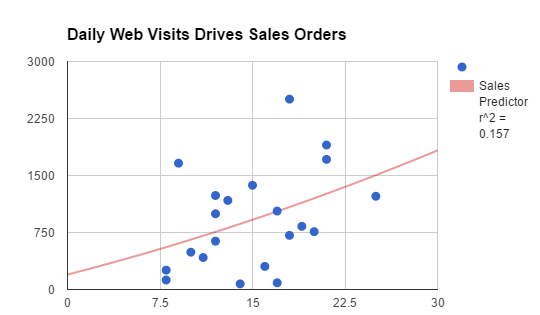
Daily web visits drives sales orders
We lowered Google Adwords cost by 37% by leveraging SEO enabled by machine learning Artificial Intelligence algorithms and increased daily sales order volume
I (Umer Qureshi) recently applied a MS Azure Machine Learning algorithm experiment for Google Adwords data. We have been able to reduce cost and increase daily order volume. Below is the experiment overview and details of the whole process step by step.
Overview: We have used SEO and Google Adwords to boost our sales by first applying simple mathematical models. More recently we have turned to more complex machine learning algorithms, leveraging Microsoft’s Azure ML platform.
First, I extracted all data from Google Adwords for our flash drives business and after cleaning it up (removing duplicates and missing fields, etc), I saved it into a CSV formatted spreadsheet. Next, I uploaded that CSV to Microsoft Azure ML to conduct an experiment to see if I could develop an algorithm to predict my conversions.
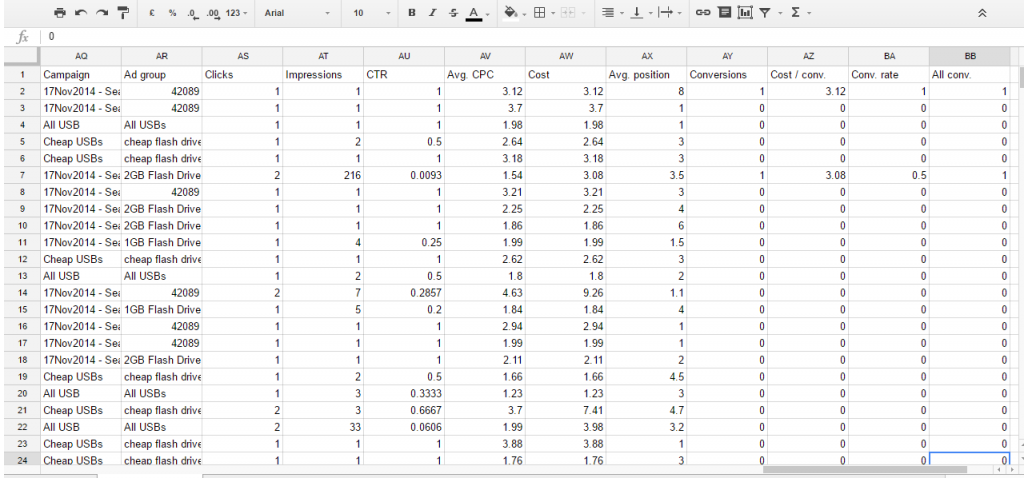
When there are low sales or less traffic or even if we want to increase our sales we use Google Adwords along with SEO to drive higher volumes. I have extracted that data from the Google Adwords account for the Ad campaigns we have run in past 2 years. I brought that data into MS Excel cleaned it up and saved it into CSV file format. Below is a snapshot of the MS Excel file:
Machine Learning Google Sheets
You can see different columns in this excel files. These are are variables. Since we want to get more clicks to our website, “clicks” will become our dependent or “y” variable and all other variables such as average ad position, impressions, etc. will be the “x” variables — on which clicks is depending.
Let me explain the few important variables here.
- Clicks: Number of client clicks to arrive at our website for a given keyword searched by visitors.
- Impressions: Impressions means number of people to which our ad was shown. Many people may view ad but not click on it.
- CTR: Click through Rate is defined as the number of clicks on an ad divided by the number of times the ad is shown (impressions), it is show in percentage.
- Avg CPC: Average CPC stands for Average cost per click. How much on average Google charges us for that keyword.
- Cost: Actual cost per click
- Avg Position: Average position shows our average position for a specific keyword. Higher positions on Google page (1 or 2) tend to have higher CPC and get more clicks than those at the bottom of the page (4 or 5)
- Conversions: They show how many people are converted. Conversions can be defined and set up in different ways. For us a conversion is anytime we get a visitor to complete our online request for quote webform.
Experiment: Microsoft Azure Machine Learning
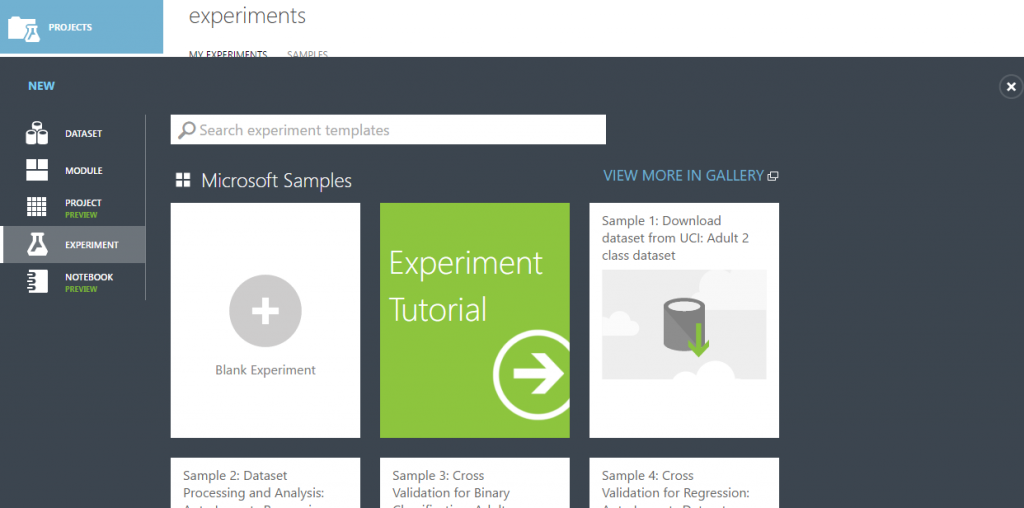
To conduct this experiment I logged in to Microsoft Azure machine learning and uploaded the CSV formatted spreadsheet and started a new Blank Experiment.
Experiments Microsoft Azure Machine Learning Studio
Step 1: I brought data set into Experiment and added a column selector. I started with a simple model, and used costs, impressions, avg position and clicks.
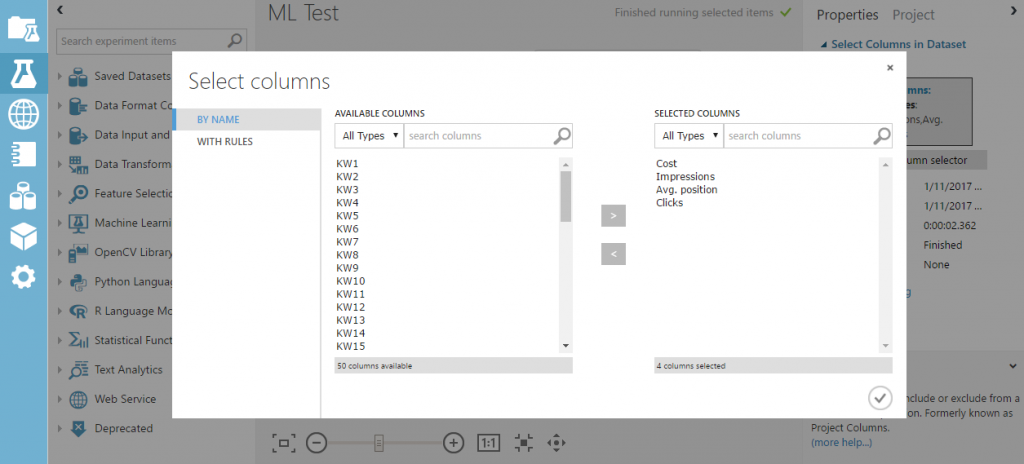
Experiments Microsoft Azure Machine Learning Studio Step 1
Step 2: Next, I added a split data, dividing the data into sample sets of 70%-30%.
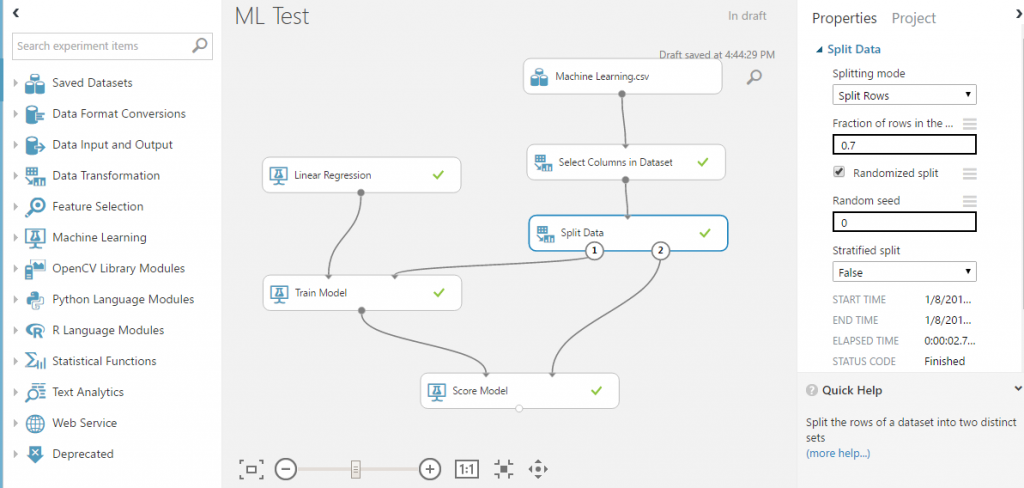
Experiments Microsoft Azure Machine Learning Studio Step 2
Step 3: Then I added train model and linked a linear aggression algorithm to it. I trained the model for 70% of the data from split data for ‘y’ variable “clicks.” This forced the algorithm to look for patterns to determine which how best to weight all of these factors (costs, impressions, avg position) in order to best predict that we will get a click on the Ad and have a visitor to our website.
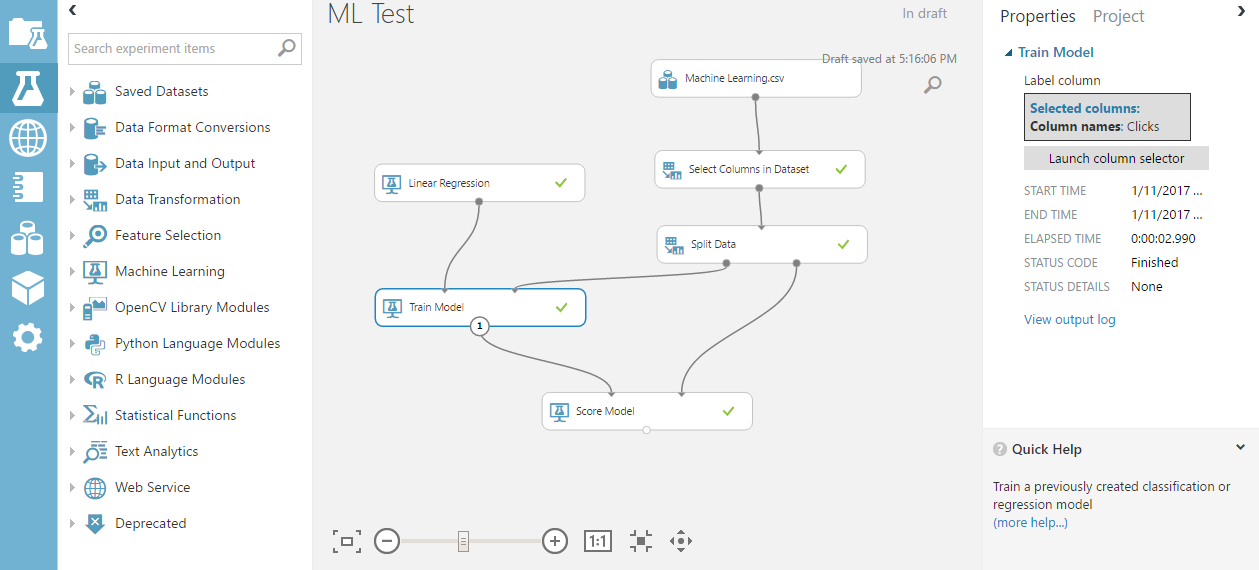
Experiments Microsoft Azure Machine Learning Studio Step 3
Step 4: Next, I added a Score Model and linked the Train Model results to it. I linked the remaining 30% of the data from the Split Data into the Score Model. Now my linear regression model will train the 70% of data, develop an algorithm and apply that algorithm to the remaining 30% of the data. We should then be able to see how well the model predicted outcomes of a click for that 30%.
Results:
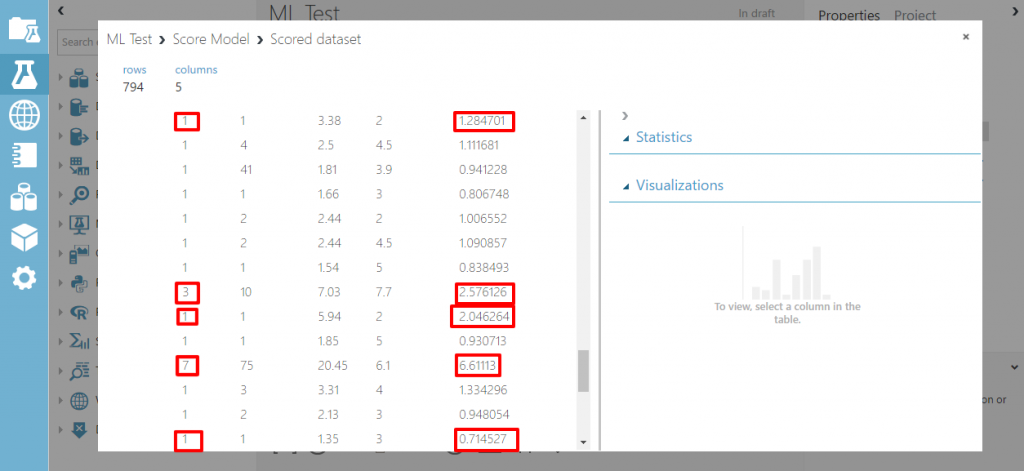
Here are the results of the experiment. It shows 794 rows that is 30% of our actual data and 5 columns. The last column “Scored Labels” is the column indicating what our algorithm predicting for number of clicks. If we look at the first three (3) rows of actual Clicks vs Scored Labels, we can see how well our algorithm predicted.
Clicks vs Scored Labels
1 1.184
1 1.181
2 1.29
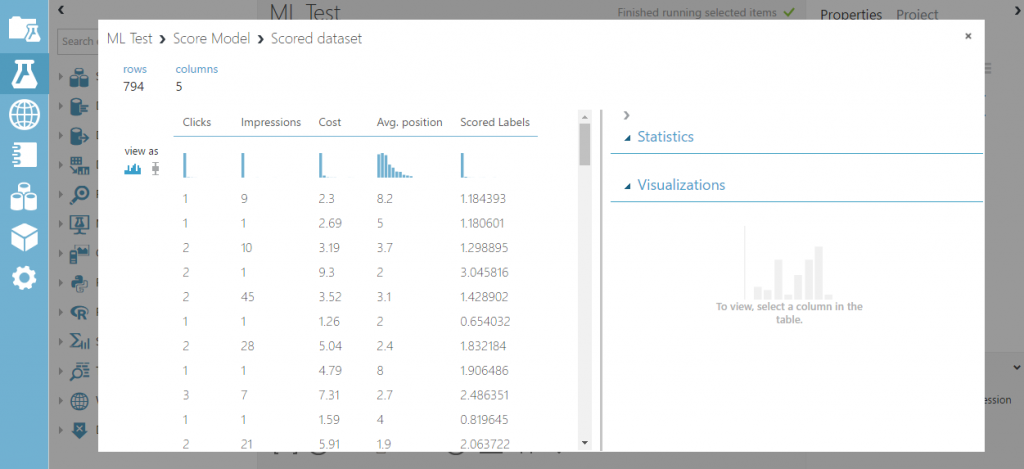
Experiments Microsoft Azure Machine Learning Studio Results
Let us go a bit deeper and see just how well our algorithm is predicting.
Experiments Microsoft Azure Machine Learning Studio Results Deep
There are lots of points on which our algorithm predicted very well expect for one point. A quick scan reveals that our linear regression algoritm is a pretty good predictor of actual click results. Additionally, below you can see how closely the figures of the actual click match our predicted scored labels (mean, median, standard deviation).
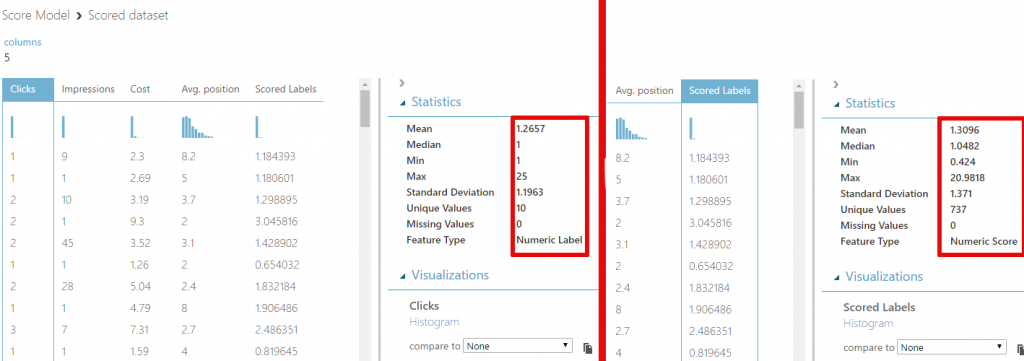
Results Matching