Increase Sales with Machine Learning Algorithm
As you can see in the graph below, our Machine learning tool predicted sales very close to actual sales. Red circle represents our lies. Our model has trained itself and is now able to predict sales for this store. This will help us in predicting products give us most profit and which customers thus increasing sales and profit.
Increasing sales makes us feel comfortable whereas when it goes in the opposite direct that creates an alarming situation. Simple sales analysis is always recommended for you products and services so you can analyze trends and fix problems as they arise. We found this Super store data set online. Analyzing this type of multiple product’s data explains easily about products trends; which one is going up and which products are declining. Analyzing this past few years data will help us get the sales pattern and help us predict the sales and eventually increase profit by investing in most profitable products. This doesn’t restrict to just products, this analysis will let you decide which customers you should be focusing, in which month or week the sales gets higher for a specific product. This analysis also enables us to sale out products before they get declines; you can sale that out bu giving a discount on products.
As i explained i grabbed this data set online. Attached is the snap shot of excel sheet. You can also view this sheet here: Superstore Sales Excel Sheet
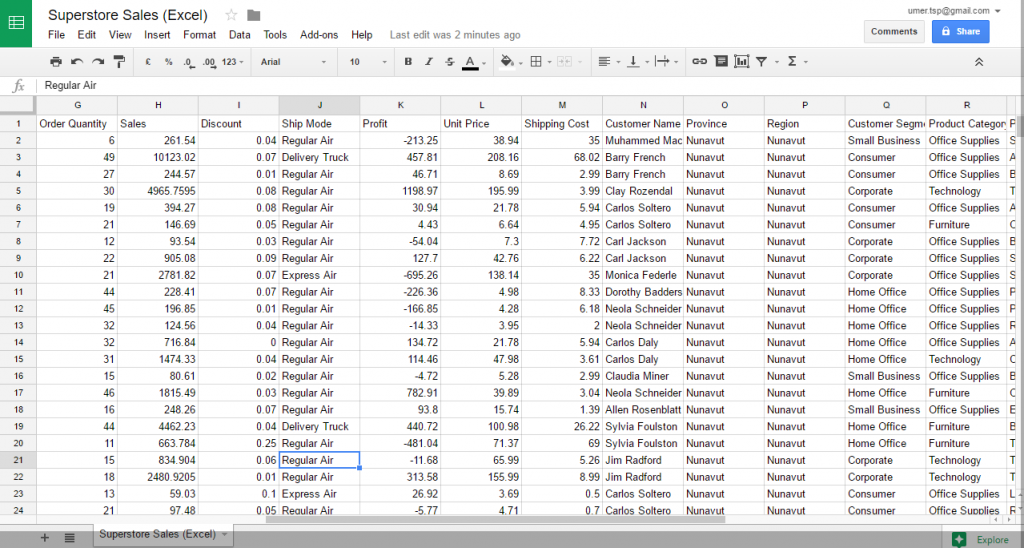
Superstore Sales Excel Google Sheet
This Excel sheet contains all variables on which sales are depending; Unit price, order quantity, sales, profit, shipping mode, product category and even sub category along with name of customer, province, region etc. I added the data in Years-Months and Week number so we can analyze if there is a specific week on which sales was higher? Negative sales represents loss.
Step 1: Data set loading into Azure and starting a blank experiment
I saved this excel sheet into .csv file and uploaded it to Microsoft Azure and started a blank experiment. The i brought in the Column Selector and select all those variable which are important to analyze and sales depends on those.
I selected only most relevant columns for sales. There was no discount any any product so it is neglected. I only used week number, order quantity, profit, unit prices, customer segment, product category, shipping cost, province and sales. Check the attached image for details.
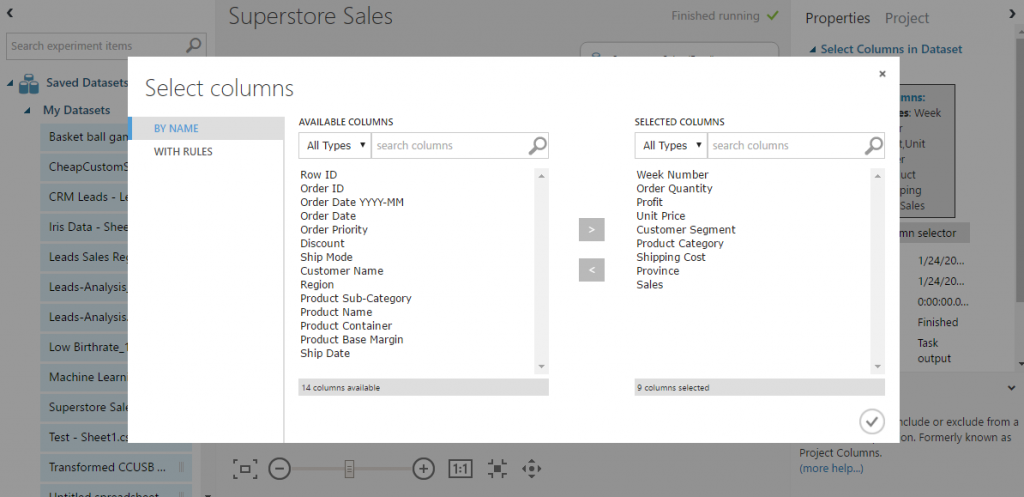
ML Superstore Sales – Column Selector
Step 2: Training Model for Sales Prediction
I added a split data and put 70% of the data into train model and applied linear regression then i linked train model and 30% data from split data and added them to scored model.
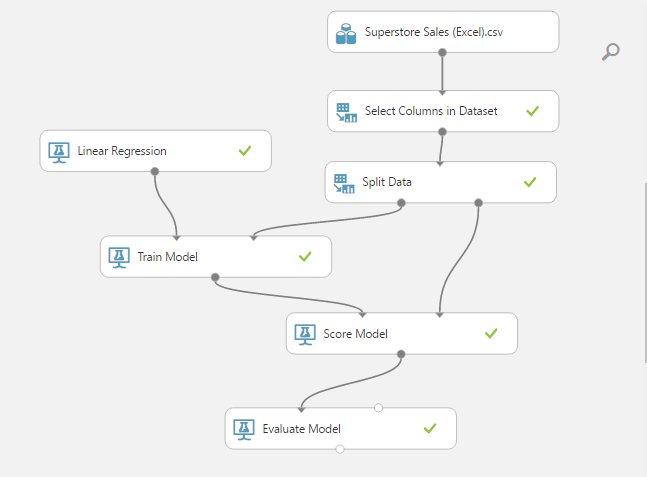
ML Superstore Sales – Expermient Overviewpng